I'm not sure where it started, or how it started, or even if there was a definite start point, but reddit has amused itself for the past few weeks by
charting various parts of the game. It's an impossible task to chart how everything effects everything else in the game, but they've made a nice start.
Actually, clicking on my own link, I think it started
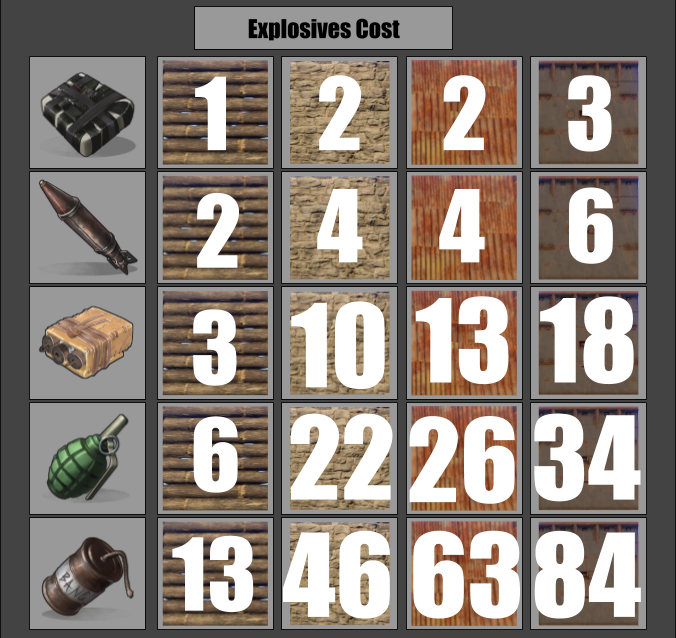
with Biohazard72's explosive cost chart.

Then the site was awash with charts, showing ridiculous dedication to parsing the various whacks and thumps of the game into resources. Take a look at this tree chart from
luizmp
Farming Trees Chart
There's more.
Have a look. Note to any future Rust players visiting this page from the year 2029: these charts are almost certainly out of date, but hello from the past! We're sorry for all the bombs and radiation. How is Mars?
 Then the site was awash with charts, showing ridiculous dedication to parsing the various whacks and thumps of the game into resources. Take a look at this tree chart from luizmp

