TL;DR - Shipping Linux binary; Server profiler should have less impact when idle and recording by gathering less data; if it fails to generate a snapshot, you can now export a debug binary snapshot and share it with us.
Linux Support
This update will contain a library built for Linux environment. The library is a native recorder, so the interface (the "perfsnapshot" command) works the same.
The library has been built on Ubuntu 24.04.1 via GCC 13.3 in C++20 mode and it depends on POSIX utilities (dlopen, dlsym) - so it should be accessible everywhere.
Profiler Overhead
Since the first release of our internal profiler, we got the opportunity to test it in the real world conditions. My first tests were rough (could only capture 1-2 frames worth of data before ballooning to multiple gigabytes of data) and I got feedback from number of server owners that not only it doesn't produce snapshots in some situations, it also has idle overhead - just enabling profiler can have a 5-10fps on a high-pop server.
I've spent some time this update cycle to to reduce this overhead, as in the current conditions it severely reduces the benefit we can get out of the tool. I've tackled it from a couple angles:
Reduced how much Code we capture
The profiler works by annotating every code method that it encounters, wrapping it in a set of calls that dispatch to different Mono profilers. Comparatively, for complex and expensive methods these call are unnoticeable, but for small utility functions that do a trivial thing (change a bool, set a bit, append to a list, etc) the dispatching calls add massive overhead (we're talking 10x+ the cost of the utility function). Lastly, these dispatching calls are cheaper when the profiler is enabled, but not capturing - but they are still not free.
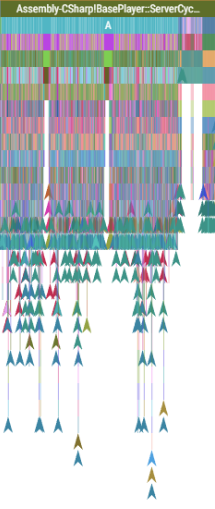
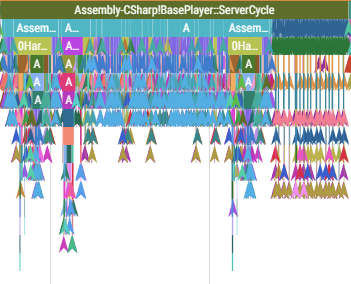
Originally I set up a number of annotation filters to exclude some known and safe code (stuff from System.Collections.Generic namespace, for example), but it still left a lot of "fat" that we could trim. Here's the before and after of the changes affecting our player processing loop:
As you can see there's much less of nested calls(reduced verticality), and instant calls (triangles, they take less than Perfetto is able to track) appear much earlier.
This update we no longer capture:
- Hash functions
- Casting & comparison operators
- Property getters
- UnityEngine.CoreModule related code
- Enumerators
- Anything Math related
- Our internal collections (like BufferList)
- Serialization code
There's more, but hopefully you see the principle behind the choice - anything small, trivial or reliable gets ignored.
This allowed us to massively reduce the amount of data we generate during capture - on staging server, we used to generate about 17MB of json per player, after these changes it's gone down to ~0.5MB of json per player. This should also reduce the "idle" overhead, since there's much less "dispatch code" that's scattered around.
Improved json generation logic
One of the quirks that we have to deal with profiler-gathered data is that it doesn't know where the frame begins and ends - it's just a stream of "method enter/exit" records + "frame end" record that happens somewhere deep in the managed callstack. And since we want to display the data in a per-frame organized matter, we need to scan this stream to figure out how to partition all records.
Originally I implemented a less-efficient version of this because I assumed that there wouldn't be too much data to overwhlem this process. Since the previous section showed that I was wrong on the scale of data, I've also spent a bit of time to improve the export process - we now only need 2 whole-data-set scans to figure out frame grouping, instead of 3 originally, so using napkin-math, this gives us 33% export speedup.
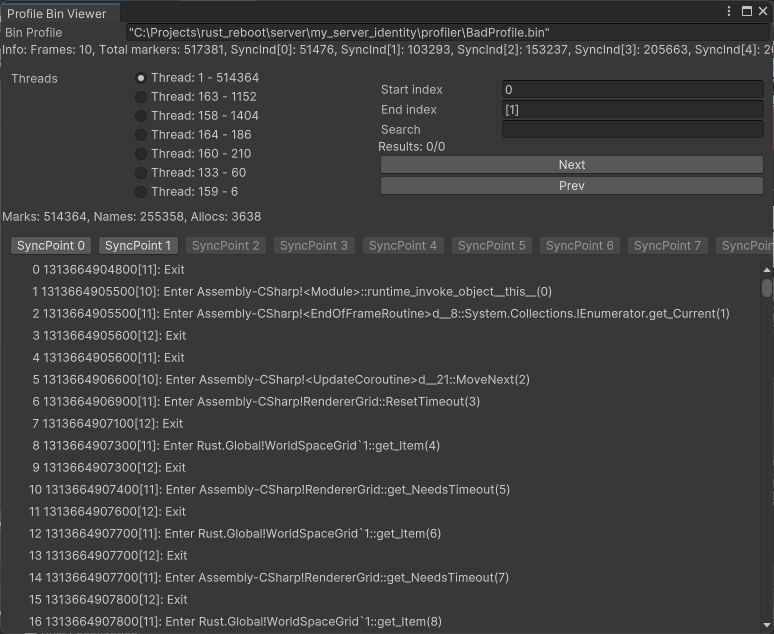
Additionally, I've received reports that profiler can fail to generate snapshots. There are a couple scenarios in the above frame-reconstruction logic that can cause it to fail, so for these cases I've added the option to dump a binary debug snapshot - just run "perfsnapshot <delay> <name> <frames> 1", and you should see a "<name>.bin.gz" in "<root>/server/<identity>/profiler/" folder. I'll be able to inspect it in our internal tool to see what am I missing:
Future Plans
I've been using this tool on the daily to inspect the state of our Staging servers, and I'm hoping to do the same with our medium and high-pop release servers as well. To squeeze out the most, there are additional improvements that I'd like to pursue when the time allows:
- Continue trimming down on annotated functions - there's still plenty to reduce.
- Need to expose the annotation filter to server owners - right now it's all hardcoded which is limiting
- Need to expand allocation tracking - right now we just track how much we allocated on main thread. We could track allocated object types, and figure out a better way to display it on Perfetto.
- Emit more metadata about the performance state - provide manual annotation tools to emit the scope of workload for our team, or to show cross-thread dependencies.
- Explore automatic capture during frame spikes.